
The new Array Time Chart in TwinCAT Scope visualizes PLC data in three dimensions directly from the controller, with precise timestamps and outstanding performance.
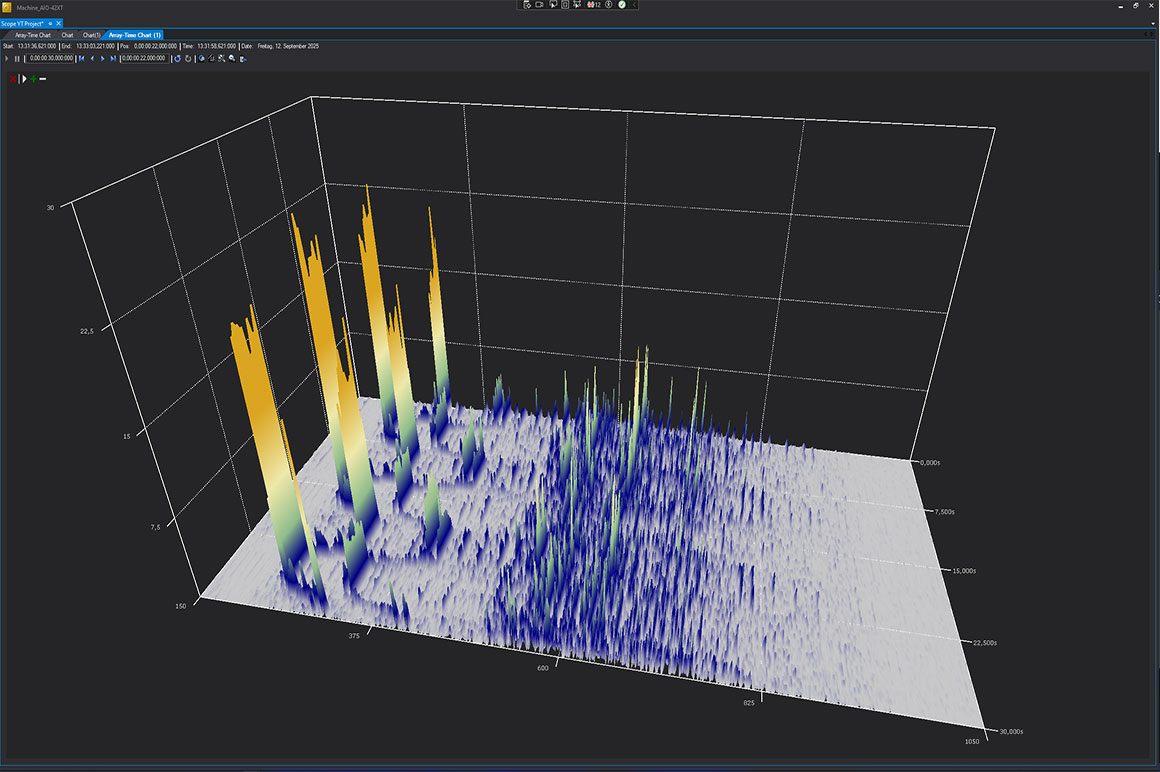
Time series, frequencies, or harmonics – all data stored in arrays can be displayed and monitored over time in Scope, either as a waterfall diagram or as a mesh with optional grid and definable color sections with gradient and adjustable aspect ratio for the perfect ratio display in perspective. Camera views can be saved and changed with smooth camera movements so that the data can be analyzed repeatedly from identical angles.
Perfectly suited for:
- frequency and order analysis
- FFT (Fast Fourier Transform) evaluations
- vibration diagnostics on drives
- test bench data acquisition
- condition and power monitoring
This allows patterns and therefore peak values and faults to be detected and interpreted quickly. The new chart will be included in TwinCAT Scope Base and in TE1300 Scope View Professional.
Products

TE1000 | TwinCAT 3 Engineering
TE1000 is the TwinCAT development environment for convenient configuration of control, drive control and I/Os. In addition, the tool includes the configuration and programming of TwinSAFE, the safety solution from Beckhoff.

TE1300 | TwinCAT 3 Scope View Professional
The TwinCAT 3 Scope View is a software oscilloscope for the graphic representation of signal curves in different chart types. These could be, for example, YT, XY, bar or digital charts. The Scope View Professional extends the Scope View Base version supplied with TwinCAT 3 XAE by additional functionalities. The field of application refers to processes that are to be tracked and monitored over a longer period of time.