
Data is gold – why, actually? Because they have a lot to “say.” This also applies in the industrial environment and especially for machines. TwinCAT Analytics helps to evaluate and interpret machine, production and operating parameters in order to generate added value for machine builders, system integrators, producers and end users. They can all benefit from improved support, new business models, better quality or more affordable products.
For all purposes alike, useful data must be separated from less useful data and fed into a suitable algorithm. The interpretation of the data is the most difficult step. The TwinCAT Analytics product family describes a complete workflow for machine data analysis: from acquisition, communication and historization of data to their review and evaluation, as well as representation in web-based dashboards.
The core is certainly the visualization and evaluation of measured data. Fast loading times and confidence in analysis accuracy are very important, with transparency playing a major role. This is achieved by the TwinCAT Analytics engineering tools, providing a configuration editor for the numerous available algorithms as well as the TwinCAT Scope charting tool for graphical representation. Due to a large number of possible interactions between algorithms and graphical representation of raw and result data, even the proverbial needle in the data haystack can be found very quickly. Here, the TwinCAT Scope configuration is especially useful – and it can be automatically generated with a single mouse click. Simple drag and drop is sufficient to transfer results from the analysis process into TwinCAT Scope View in order to visualize results or mark significant events in the data stream. For example, machine cycles can be visualized with microsecond precision.
Putting data on track
However, the high data resolution possible with TwinCAT Analytics is not always necessary – especially if users want to obtain an overview of measured values after a longer measurement campaign, e.g. over several days, and to avoid long loading times that can quickly add up. In later analysis steps, each individual cycle of the machine may well be important, but this resolution is not yet necessary for a rough assessment of the measurement. Moreover, not every measured value, e.g., during less meaningful downtimes, must necessarily be included in an analysis.
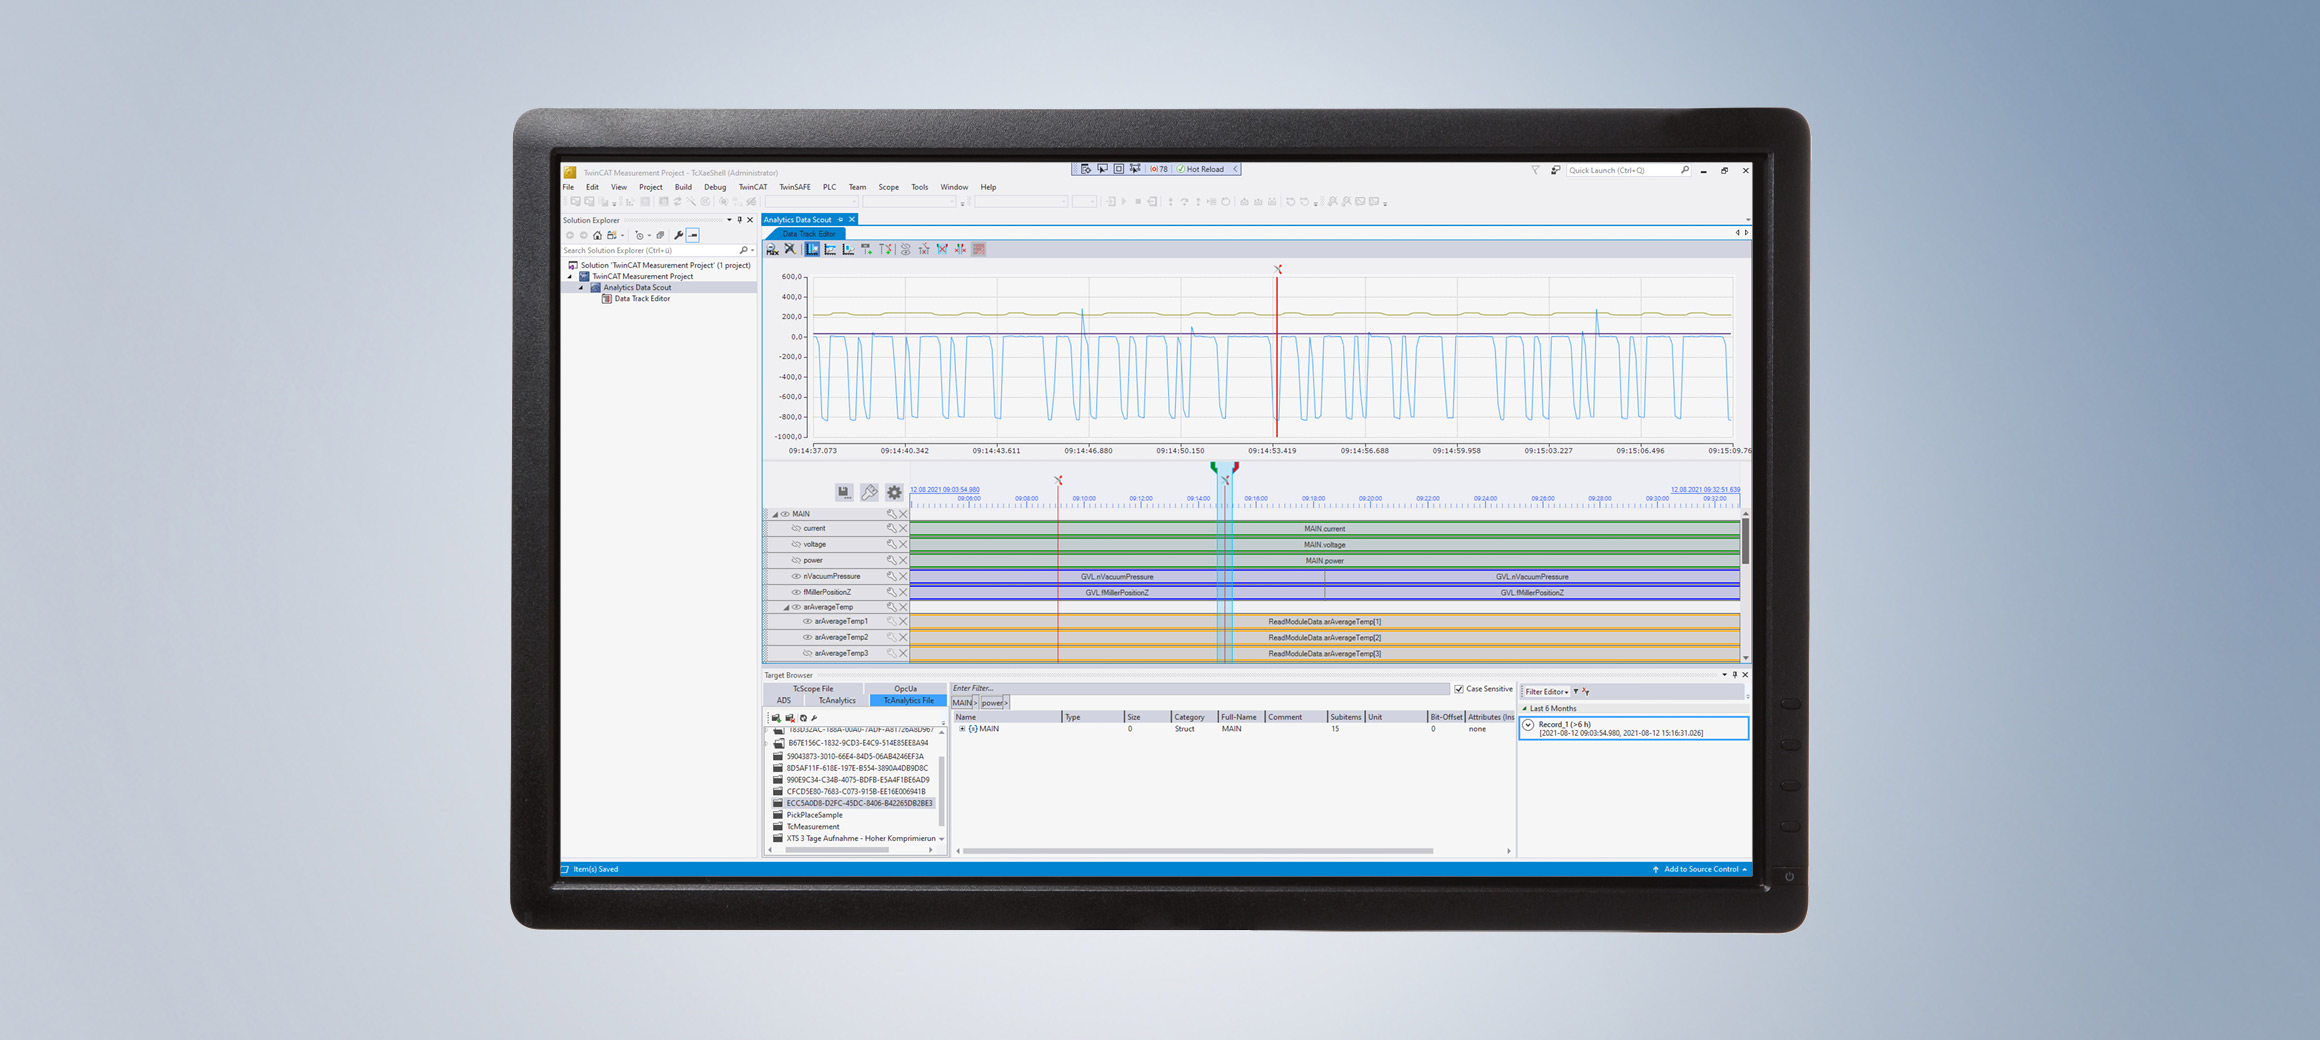
To meet the demand for data viewing, the TwinCAT Analytics workflow was supplemented by TwinCAT Analytics Data Scout. Integrated in the well-known TwinCAT Measurement project in Microsoft Visual Studio®, it offers a Data Track Editor. This is ideally suited to gain a quick overview of individual data recordings; it can be fed with data directly from the TwinCAT Target Browser. New data compression and data indexing methods make it possible – depending on the process image size – to load the data very quickly in different levels of detail. The variables of the recordings are available as so-called data tracks. With the cutting function, it is even possible to cut out large parts of the data collection in the Data Track Editor to further reduce the analysis time. An overview chart based on TwinCAT Scope View helps with orientation in the individual data tracks. In addition, data from different recordings can be combined into one data stream. The data types of individual tracks can be converted to save storage space for the newly created data collection, depending on the actual value range. At the end, data export provides the new recording, which can be made available to other tools such as Scope View or Analytics Service Tool via the Target Browser.
Over 50 analytics algorithms
After an initial viewing of the data, the analysis follows. TwinCAT Analytics offers a very wide range of well over 50 algorithms for this purpose, ranging from simple edge counters and cycle time analyses to correlation algorithms, linear regression and unsupervised clustering methods. Machine data historized by means of the Analytics Storage Provider (TF3520) can be made available to these easily reconfigurable algorithms repeatedly and with very high performance. In this way, it is possible to generate special features from the input data – for example, for the application of ML-based methods – and then to load and process them again. New ideas can be tested very quickly based on existing data before using Analytics Workbench (TE3500) to automatically generate continuous data monitoring of machines, including an Analytics Web dashboard, and download it to a target with Analytics Runtime (TF3550).
If the large number of algorithms is still not sufficient for the desired application, there are various extension options. On the one hand, other TwinCAT PLC libraries with mathematical algorithms, such as the filter and condition monitoring libraries, can be used directly in the Analytics engineering tools. On the other hand, users can extend the algorithms with code using the new Analytics Lambda functions. Lambda functions are written in C++ and can thus provide user-specific algorithms. Throughout the implementation, the user is supported by a wizard. The process ranges from creating the basic structure with inputs, outputs and parameters, to the programming itself, through to releasing the algorithm so that it is available in the Algorithm Toolbox for all further analytics projects. The self-developed Lambda function can be chain-linked to standard algorithms, and the Workbench can be used to map one of the existing Analytics HMI controls or a completely self-written control in JavaScript or TypeScript. For PLC code and dashboard generation, PLC code and the selected HMI control will be generated for the Lambda function. The same applies to the future integration of MATLAB® and Simulink® algorithms. The integration into TwinCAT Analytics is achieved by means of the existing TE1400 and TE1401 products.