TwinCAT Analytics is a tool for data analysis from one local or from many distributed machines. The TwinCAT Analytics product family represents the entire workflow of such an analysis and includes a wide variety of algorithms for the analysis of live data as well as historical data. The data that is processed into valuable information and forms the basis for decision-making with the help of TwinCAT Analytics represents the "raw material" for this workflow.
Our data value chain – process steps in TwinCAT Analytics
In the following sections, we will take you along the path of data – from the collection of raw data to possible measures and optimizations – of course completely based on TwinCAT Analytics.
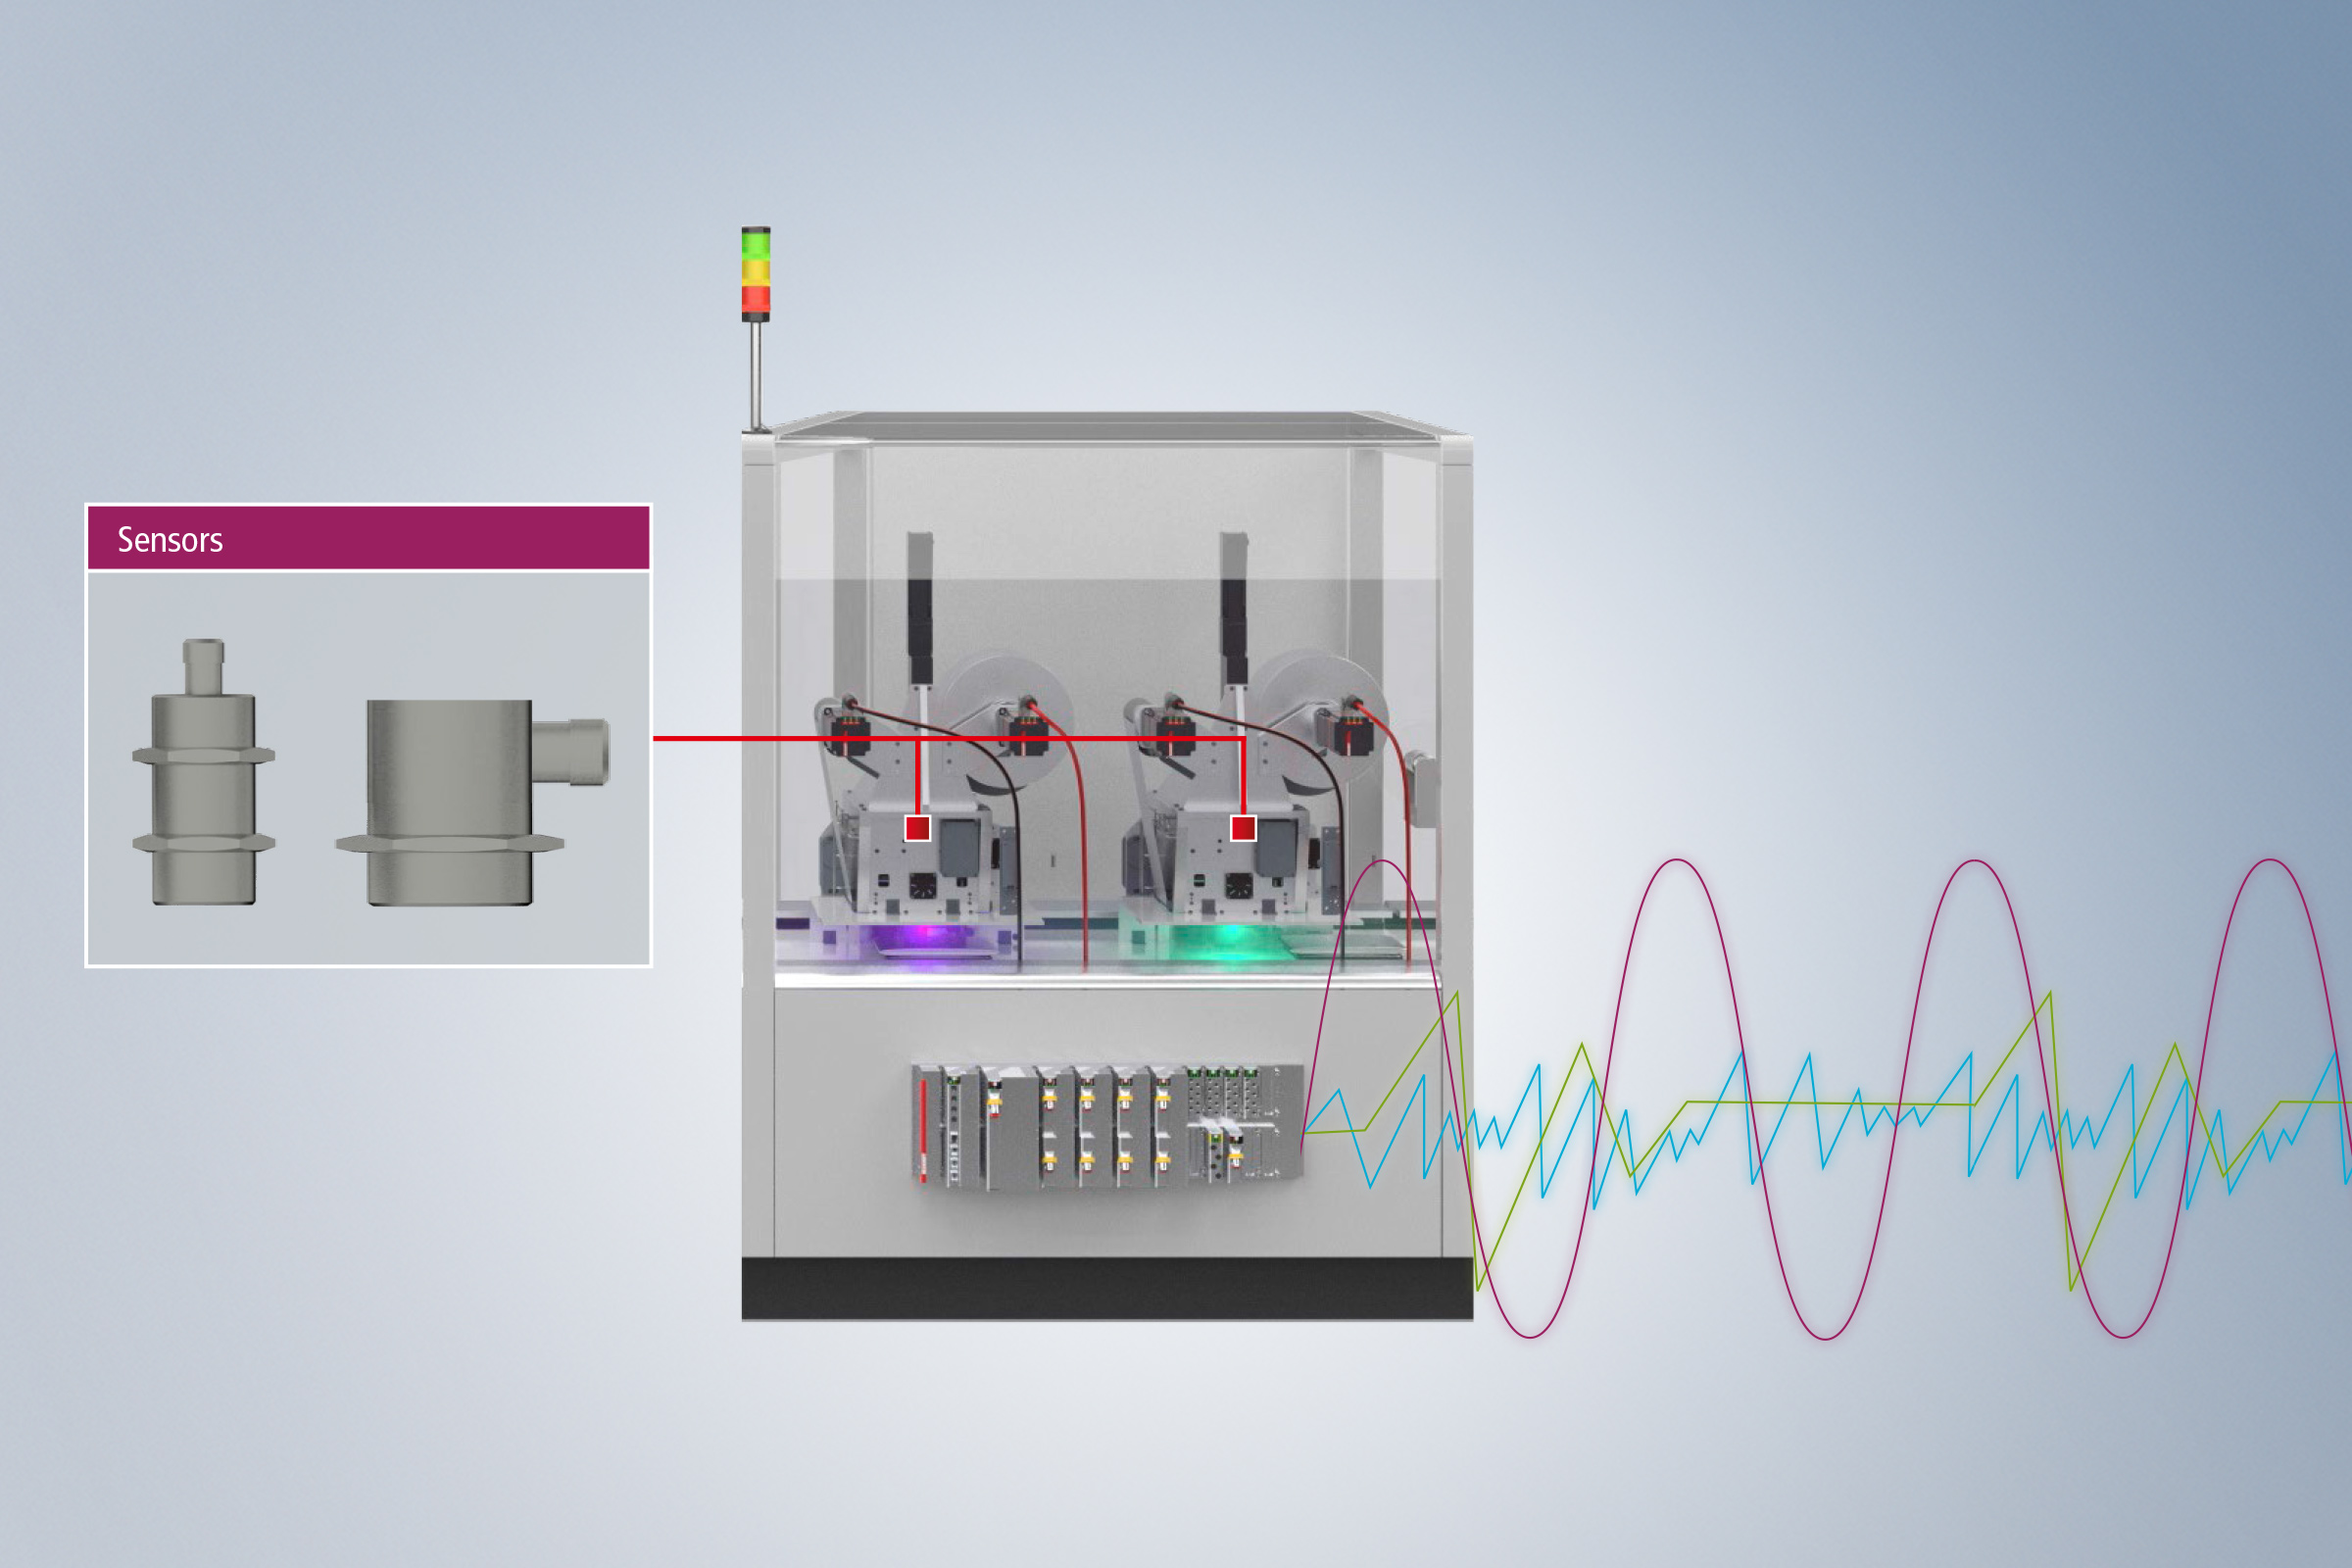
Step 1: Raw data acquisition
Where does the data actually come from?
The quality of an analysis correlates with the quality of the data ("garbage in – garbage out"). Therefore, raw data collection represents the starting point of the data value creation process. For successful analysis, it is relevant to recognize which data is needed for which purpose and how fast changes have to be recorded (sampling rate). TwinCAT Analytics offers different options for the continuous acquisition of the process image. With the help of high sampling rates, large amounts of data can be acquired in real time – for high data quality as the basis for successful analysis and model building. The use of the TwinCAT 3 Analytics Logger is particularly effective, but other well-known and proven technologies and products, such as the TwinCAT 3 Scope View or the TwinCAT 3 Database Server, can also be used.
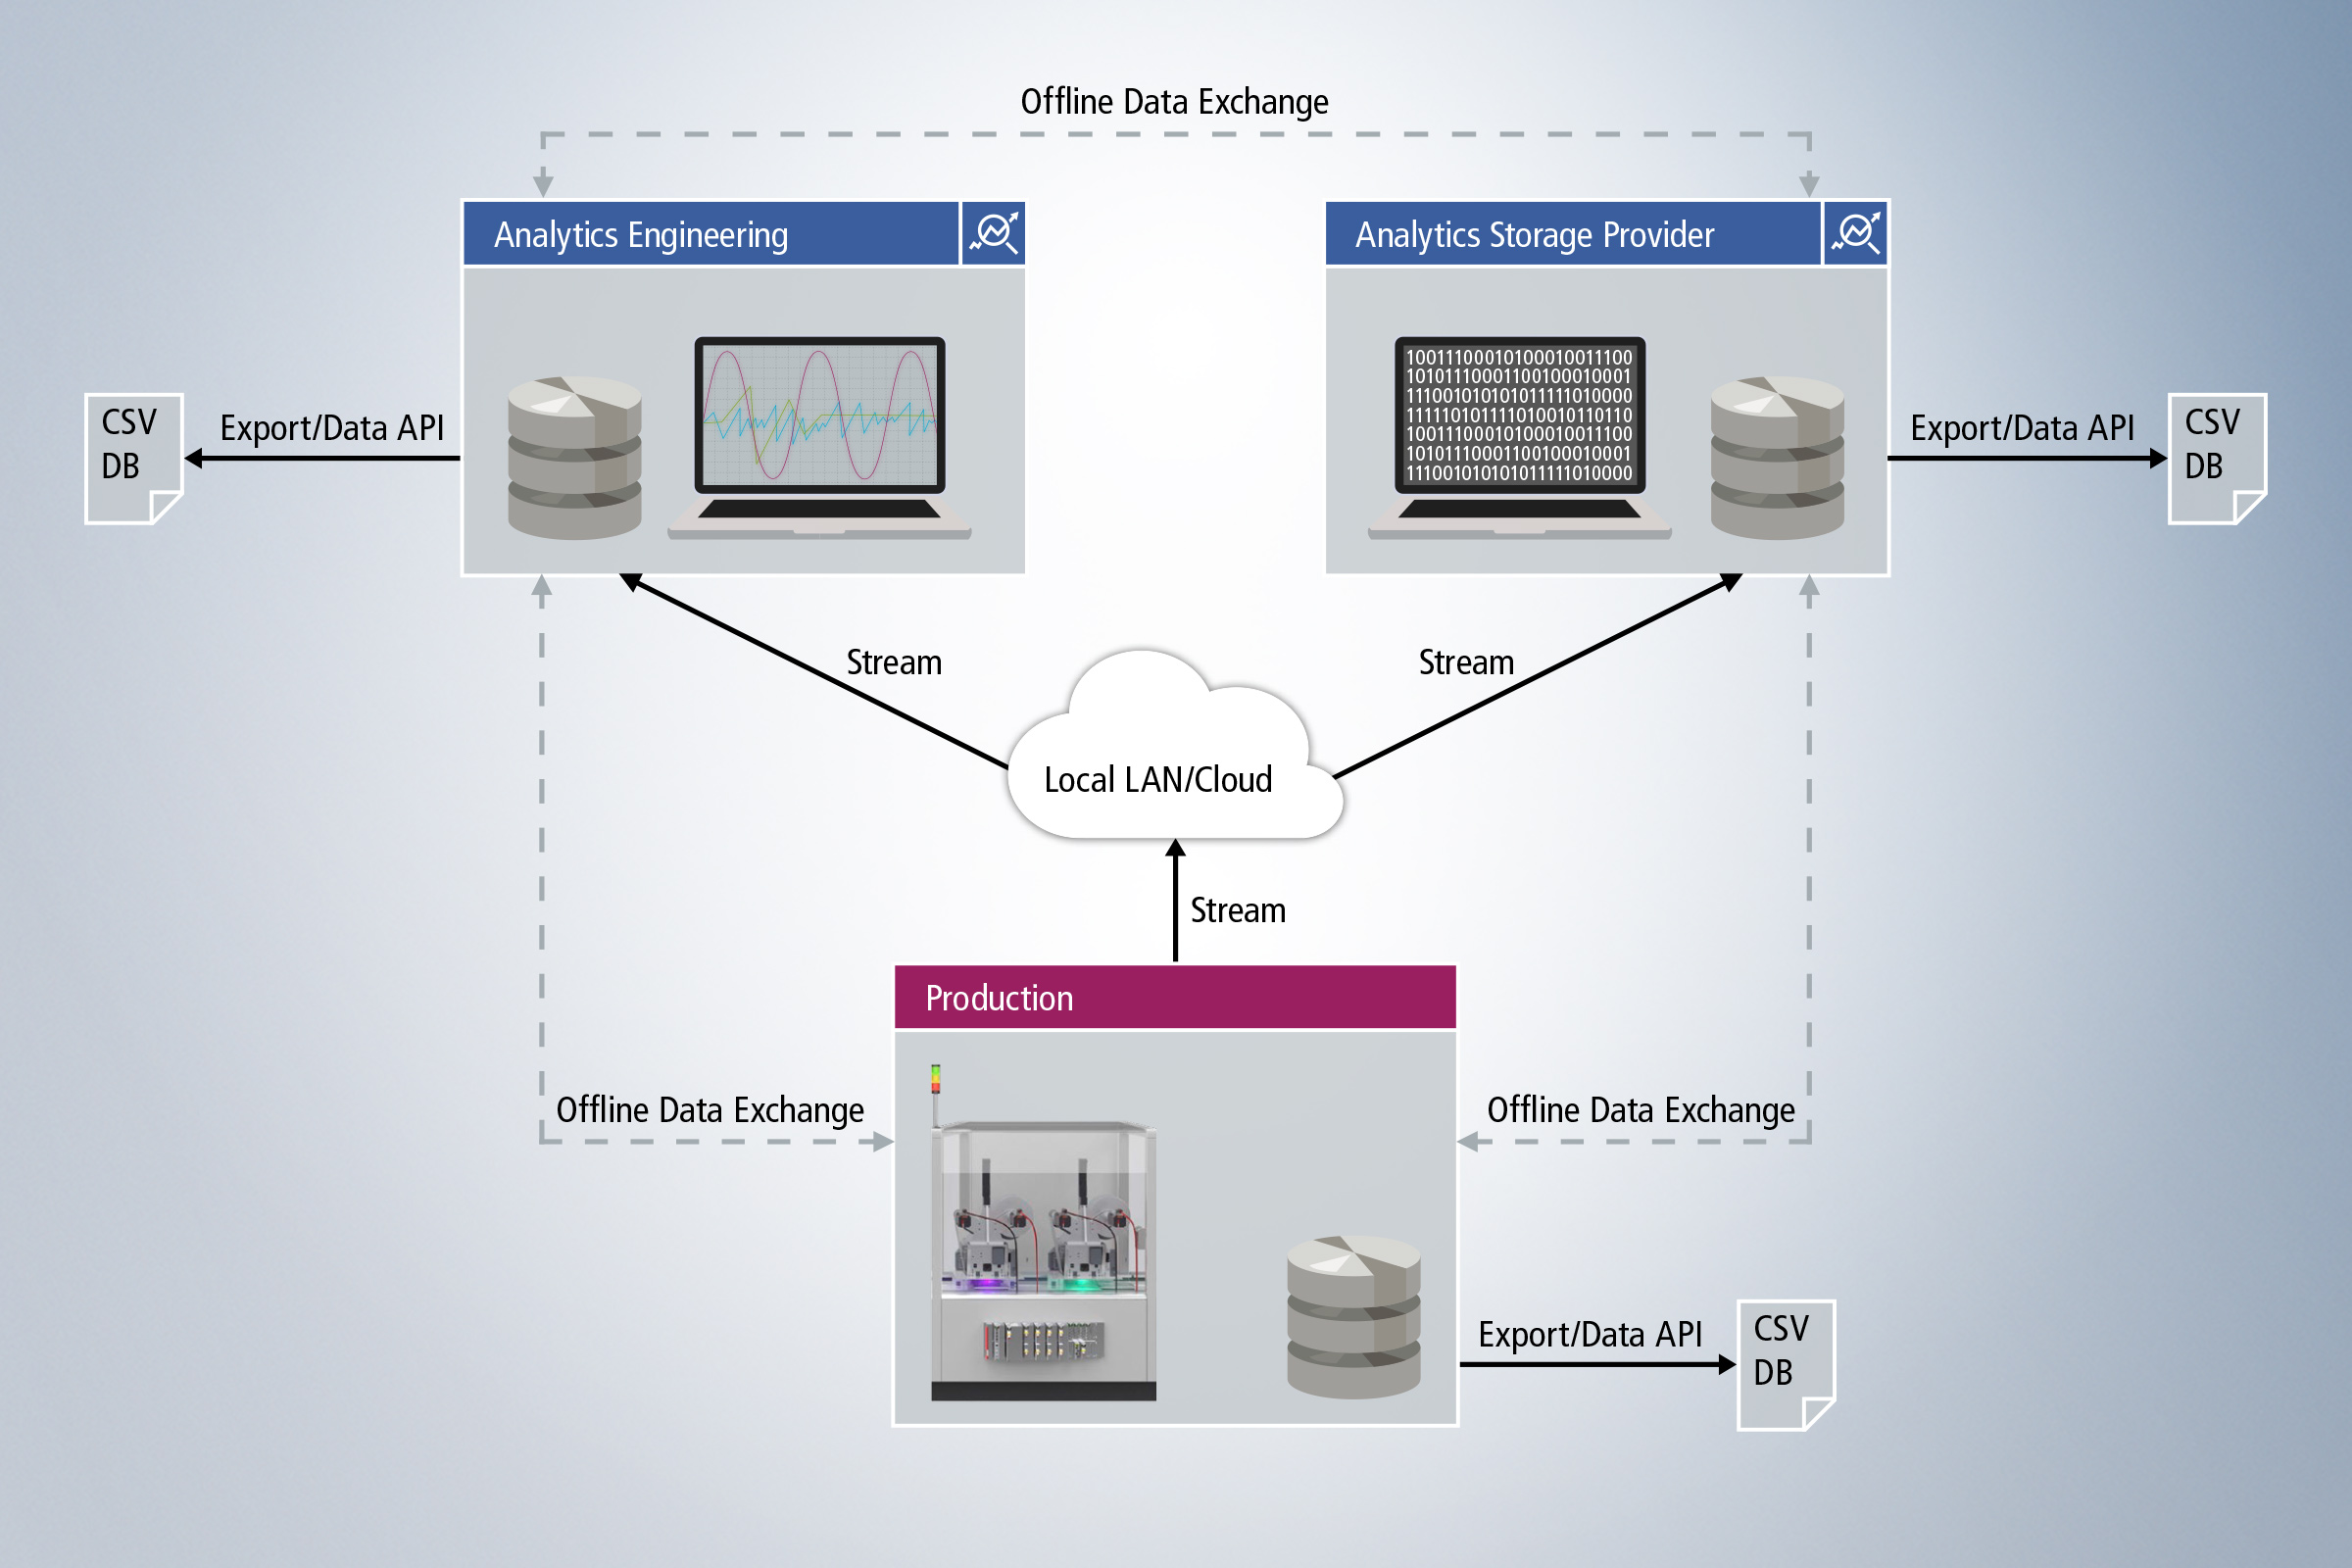
Step 2: Data storage and communication
How does the data get from the collection location into my analysis?
Where is the data stored and what are the access options?
Following data collection or directly during the collection of data, it must be transferred or stored. Our products offer you a wide range of possibilities. Live data can be transmitted directly via ADS or MQTT for live analysis. If the data was initially historicized on the local target system or in the network with the TwinCAT 3 Analytics Storage Provider, analytics files can be transferred to another system and archived at a later time. Import to databases or export to other file formats are also possible.
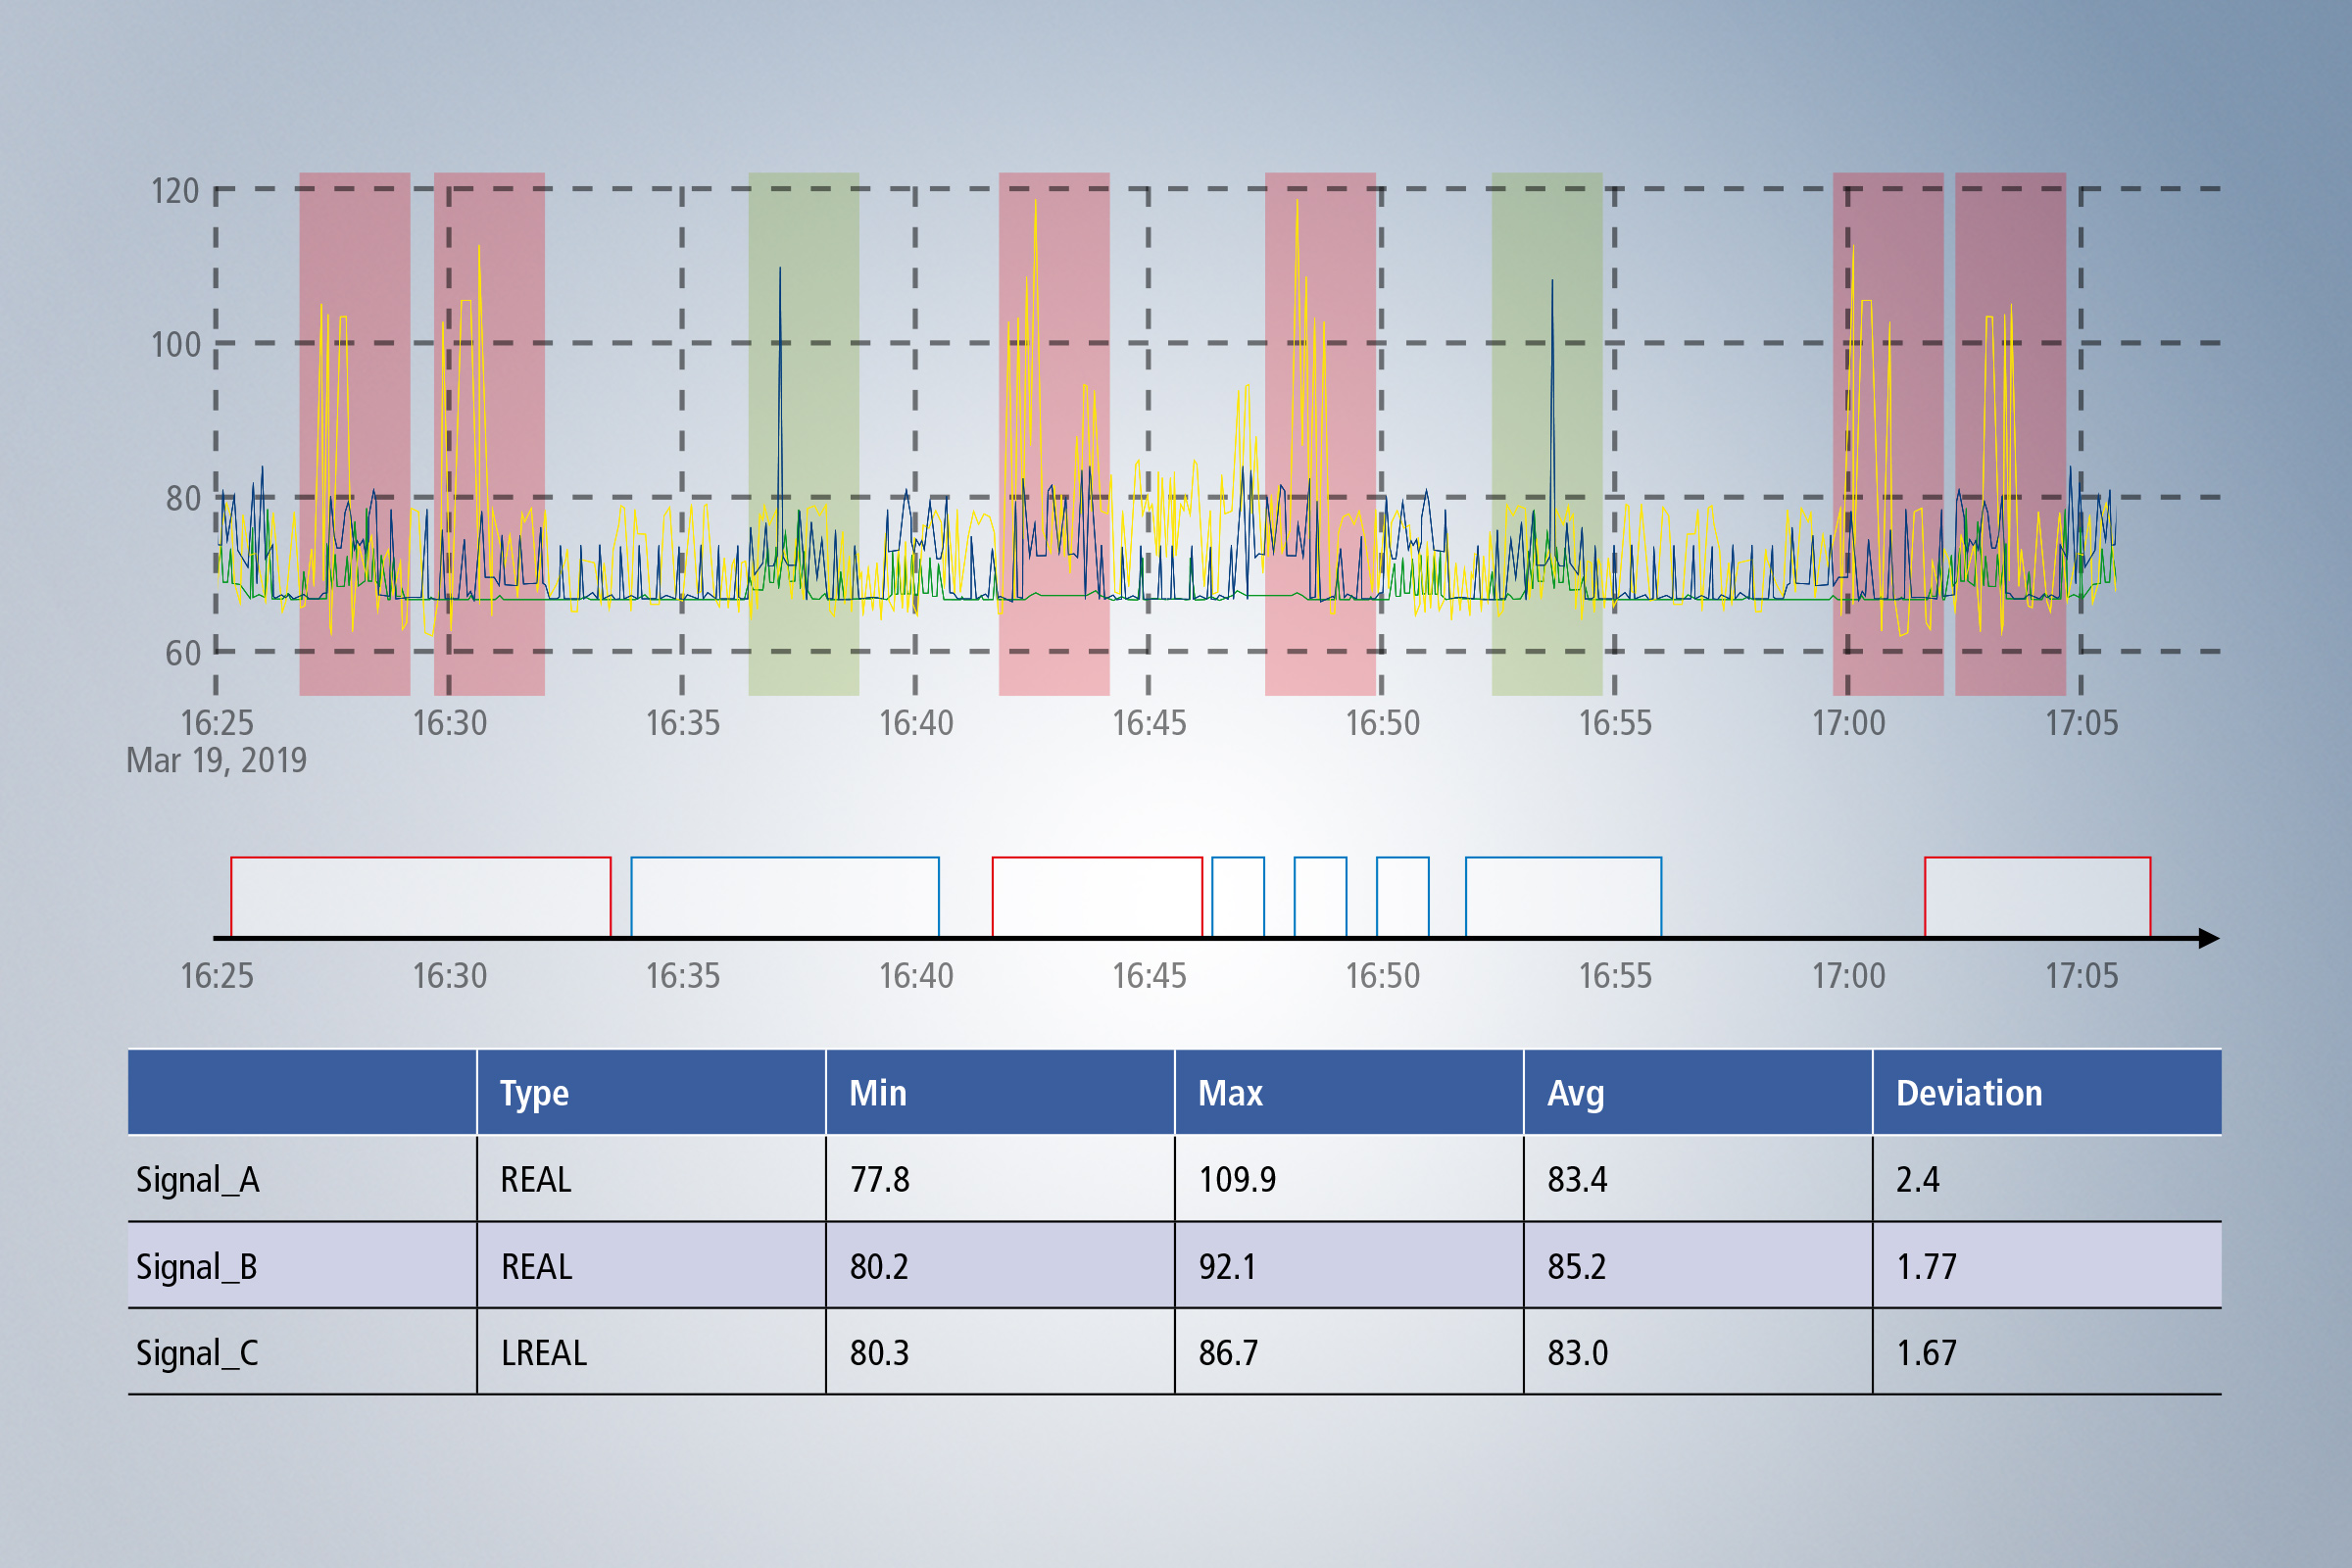
Step 3: Data preparation and exploratory (pre-)analysis
How is the data processed and made available for the analyses?
How is a problem-specific analysis designed?
In many cases, the path to a successful analysis leads first through data pre-processing and exploratory pre-analysis of the data. This is because it is not always clear from the outset which data streams need to be processed using which algorithms in order to arrive at a meaningful analysis chain that delivers the desired results and recommendations for action. Therefore, relevant data streams and, if necessary, time periods and events must first be identified. The Data Scout, which is integrated in the TwinCAT 3 Analytics Workbench and in the TwinCAT 3 Analytics Service Tool, can help you with this. This provides a quick overview of individual data collections and also allows data from different data collections to be cut and linked to form a new data stream. Once the appropriate data has been selected, suitable algorithms and links must also be found. For this purpose, the TwinCAT 3 Analytics Workbench with the integrated configurator offers the best possibilities. You can easily drag and drop the various algorithms from the toolbox into the configurator, link them with your data and other algorithms, and parameterize them according to your ideas. If you need user-specific algorithms, it is also possible to extend the existing algorithms with the new Analytics Lambda functions, which can be implemented with the help of a wizard.

Step 4: 24/7 data collection, analysis and integration into operations
In which way can the created analysis be used permanently and continuously?
Following the identification of relevant data, you can select it for continuous data collection. For this purpose, the TwinCAT Analytics Logger can be configured again; it writes the selected data streams during the runtime of the control and thus enables continuous data acquisition. Automatic code generation allows you to generate PLC code from the problem-specific analysis chain previously created in the Workbench. This can then also be permanently integrated into the operation and perform the desired analysis of the recorded data 24/7. This makes it possible to detect possible error cases promptly and with foresight, and to uncover correlations as well as optimization potential even over long periods of time.

Step 5: Visualization of the analysis results
How can the analysis results be clearly presented?
The next logical step with regard to a permanent integration of the analysis into the operation is to continuously visualize the machine condition as well as the analysis results. The One-Click Dashboard makes this a very short step and a particularly easy one for you as a user to implement. You can make configuration settings for the later dashboard even during the design of the analysis in the workbench. The dashboard is then automatically generated and can be flexibly customized. This gives you an interpretable visualization of your data and analysis results integrated into the TwinCAT HMI, which is also an intuitive user interface.
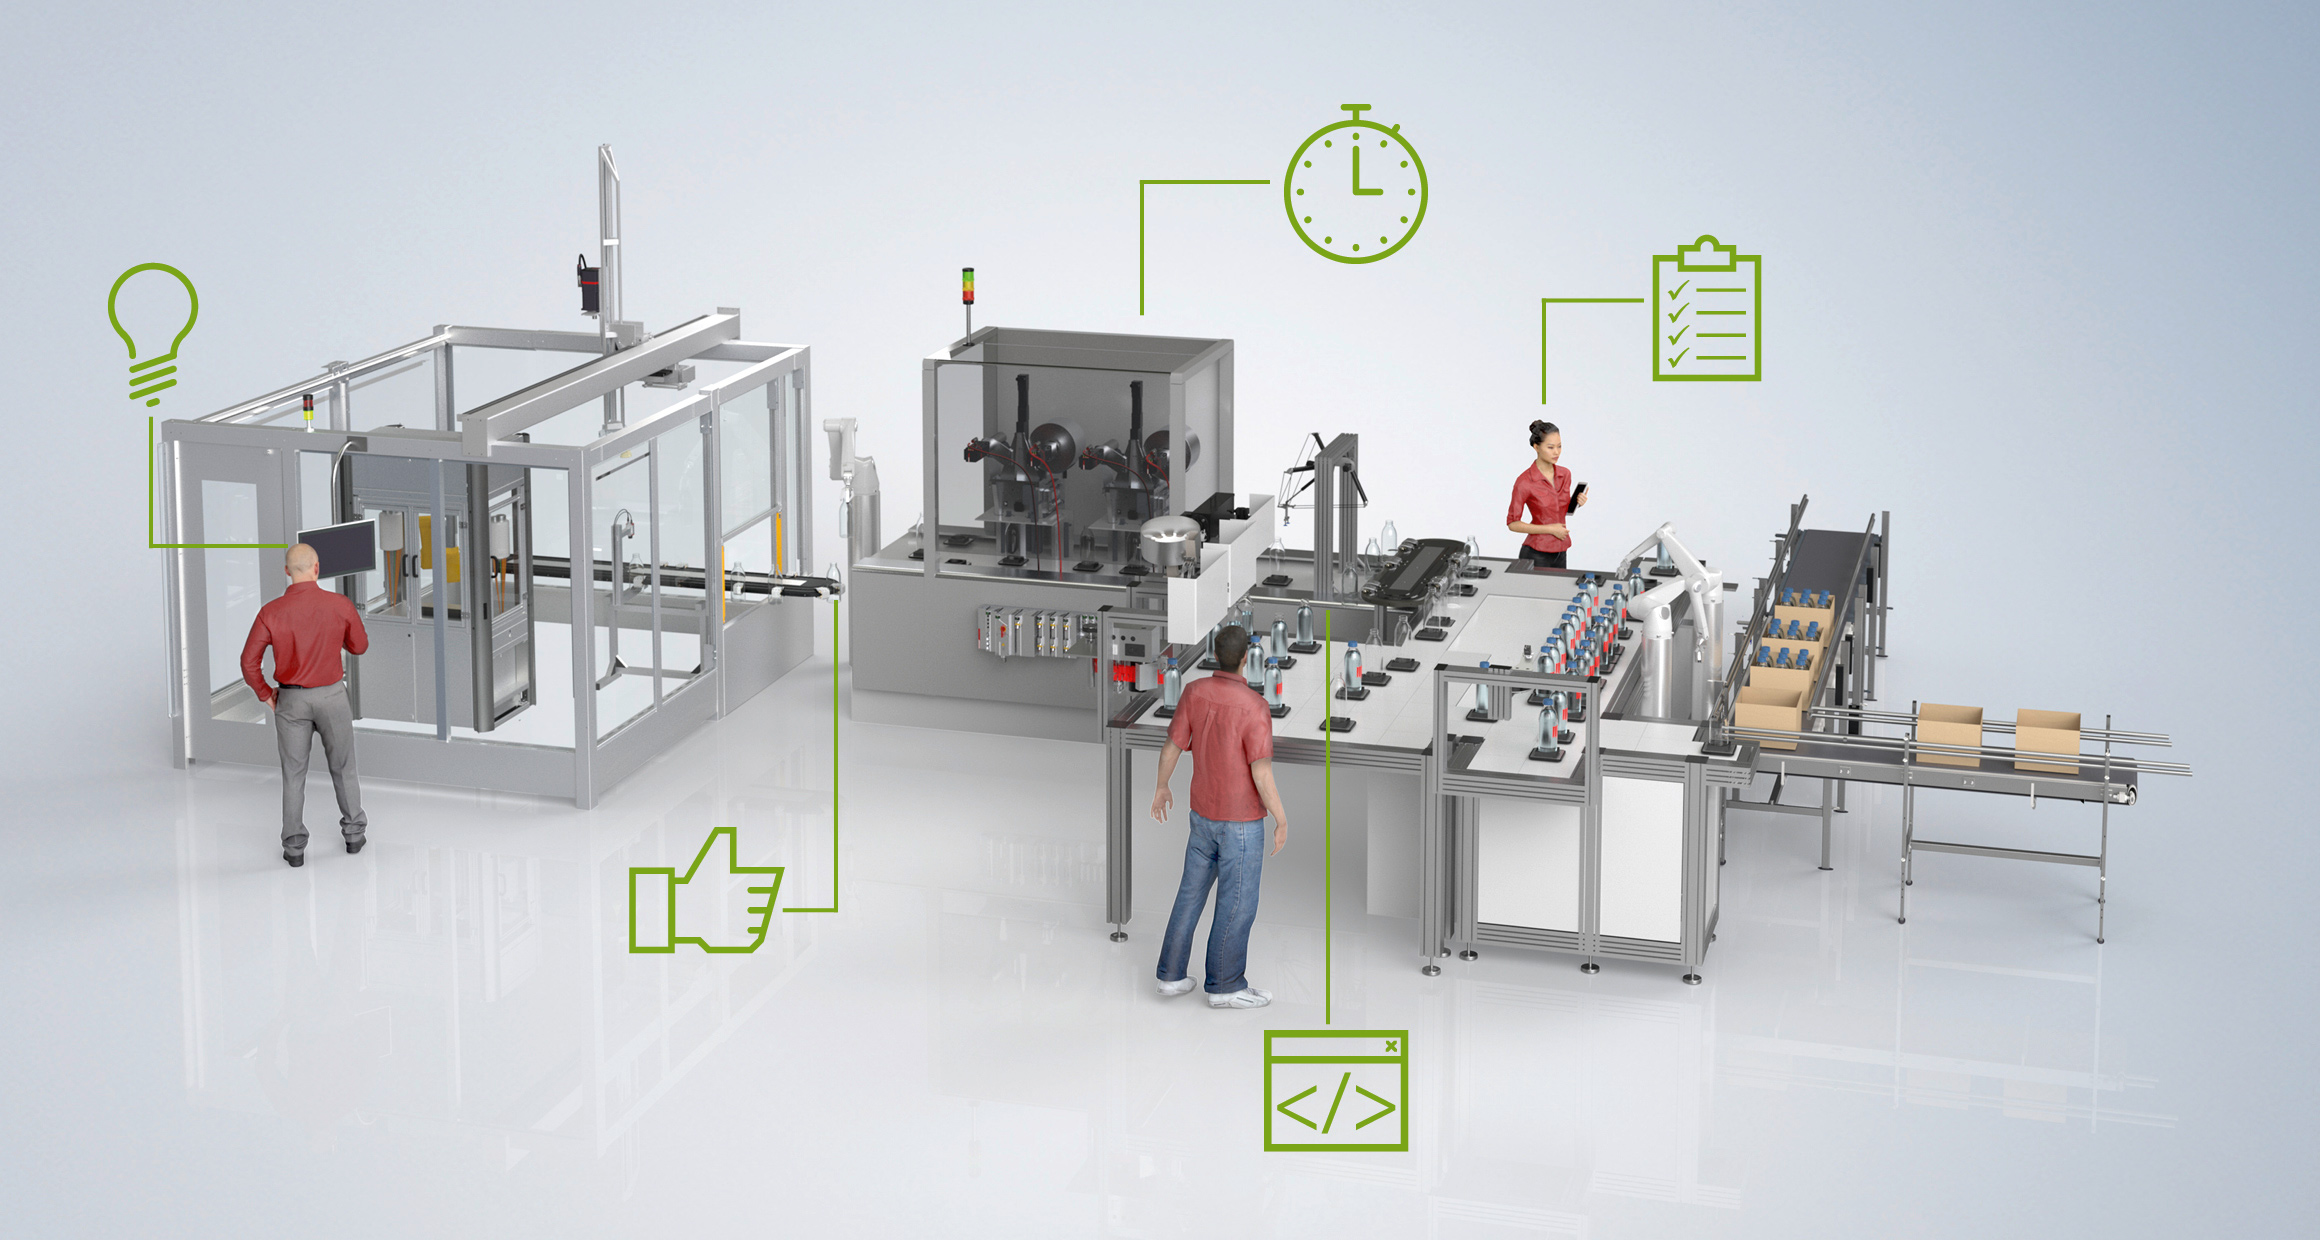
Step 6: Measures and optimizations
How can measures be derived and optimization potential be exploited?
Continuous analyses can be used to derive ongoing measures that shorten machine downtimes and extend the service life of machines and systems, as well as increasing product quality. In addition, optimization potential, e.g. for optimizing processes or machines, can be derived from the "on demand" analyses in the TwinCAT 3 Analytics Workbench or the TwinCAT 3 Analytics Service Tool and integrated into production. When actions and consequences are derived at the variable level, they can also be written directly back to the control, closing the analysis-action loop.
Our TwinCAT Analytics products in the data workflow

Learn in the following video how TwinCAT Analytics products cover all the individual process steps of data value creation. All the above steps, from raw data acquisition, data storage, data preparation, 24/7 data recording, to visualization and optimization at variable level, are implemented by TwinCAT Analytics software components. And all this without much engineering effort or sophisticated PLC code programming. Most application scenarios can be mapped by already implemented algorithms and supporting wizards.
Benefit from the simplicity of the technological implementation of data analysis with TwinCAT Analytics and use your data profitably with the development of new business models for your company which is made possible as a result.
TwinCAT Analytics video tutorials

You will find useful instructions and tips on how to work with selected TwinCAT Analytics software functions in these short technical videos.
Products

TE1300 | TwinCAT 3 Scope View Professional
The TwinCAT 3 Scope View is a software oscilloscope for the graphic representation of signal curves in different chart types. These could be, for example, YT, XY, bar or digital charts. The Scope View Professional extends the Scope View Base version supplied with TwinCAT 3 XAE by additional functionalities. The field of application refers to processes that are to be tracked and monitored over a longer period of time.

TE3500 | TwinCAT 3 Analytics Workbench
The TwinCAT 3 Analytics Workbench is a TwinCAT 3 engineering product for creating continuous data analyses. The data can come from various applications such as machines, buildings, or energy systems, for example. The configuration of the workbench is integrated into Microsoft Visual Studio and is designed as a graphical user interface. Many algorithms for configuring the analysis are available in a toolbox:
TE3510 | TwinCAT 3 Analytics Vision
TwinCAT 3 Analytics Vision offers the option of configuring and testing vision algorithms in a simple graphical representation for an application. No programming skills are required. PLC code based on TF7xxx vision products and an HTML-based dashboard can be generated automatically from the created configuration at the touch of a button. The generated code can be integrated into the machine control system and executed locally. Alternatively, the code can be loaded onto a remote device and image processing can be carried out there.
TE3511 | TwinCAT 3 Analytics Energy
TwinCAT 3 Analytics Energy offers the option of configuring and testing algorithms for evaluating electrical energy systems in a simple graphical display for an application. No programming skills are required. PLC code based on the TF3650 and TF83xx products and an HTML-based dashboard can be generated automatically from the created configuration at the touch of a button. The generated code can be used to continuously monitor RMS values for current and voltage, frequencies, harmonics, and other characteristic values to assess the grid quality. A particular advantage is that the analysis can also be linked directly to an I/O configuration so that the user can only use a TwinCAT project if required.
TE3512 | TwinCAT 3 Analytics Condition Monitoring
TwinCAT 3 Analytics Condition Monitoring offers the option of configuring and testing algorithms for evaluating mechanical and electrical components in a simple graphical display for an application. No programming skills are required. PLC code based on the TF3600 Condition Monitoring library and an HTML-based dashboard can be generated automatically from the created configuration at the touch of a button. The generated code can be used to continuously monitor the components of a machine. A particular advantage is that the analysis can also be linked directly to an I/O configuration so that the user can only use a TwinCAT project if required.
TE3520 | TwinCAT 3 Analytics Service Tool
The TwinCAT 3 Analytics Service Tool is a TwinCAT 3 engineering product for the evaluation of live and/or historicized data. The data can come from various applications such as machines, buildings, or energy systems, for example. The configuration of the Service Tool is integrated into Microsoft Visual Studio and is designed as a graphical user interface. Many algorithms for configuring the analysis are available in a toolbox:
TF3500 | TwinCAT 3 Analytics Logger
The TwinCAT 3 Analytics Logger ensures the cycle-synchronous acquisition of process and application data from the machine controller. The logger is characterized by high performance because it works directly in the real-time context of the TwinCAT controller. The data acquired is optionally transmitted to a message broker via the IoT communication protocol MQTT or stored locally in a file on the hard drive of the machine control and recorded with ring buffer functionality. The configuration necessary for this is done in Microsoft Visual Studio® within the TwinCAT project. All variables of the process image and the PLC application can easily be added to the configuration via checkbox without any programming effort.
TF3510 | TwinCAT 3 Analytics Library
The TwinCAT 3 Analytics Library is a PLC library with analysis functions for process and application data. It can be used locally on the machine controller or on a remote analysis system with an IoT communication connection. In both use cases, a great deal of engineering time can be saved with the automatic PLC code generation by the TE3500 TwinCAT 3 Analytics Workbench. For local use, only the mapping takes place manually; in the IoT workflow, even the mapping is omitted and is carried out automatically.

TF3520 | TwinCAT 3 Analytics Storage Provider
The TwinCAT 3 Analytics Storage Provider is an MQTT client and provides an interface between one or more MQTT message brokers and the relevant data storage units. Various controllers can send data via MQTT, which the storage provider can then store centrally. This can be cyclic raw data or pre-processed data. Historized data is also imported via the storage provider. The storage provider can thus output the data in Engineering for the service technician or in an analytics dashboard in the interactive chart for the production manager.

TF3550 | TwinCAT 3 Analytics Runtime
The TwinCAT 3 Analytics Runtime is the runtime “container” for the Analytics application, which was configured and developed in the TE3500 TwinCAT 3 Analytics Workbench. The runtime can be installed locally, on remote hardware or in a virtual machine. It also contains the TF2000 TwinCAT 3 HMI Server, which hosts the analytics dashboard. In summary, the TwinCAT 3 Analytics Runtime represents a bundle of different licenses. It contains a PLC runtime, the Analytics PLC library, the IoT connection with MQTT and HTTPS/Rest, the Storage Provider connection, the TwinCAT 3 HMI Server and a corresponding client package, so that several users can view the designed Analytics Dashboard simultaneously.
